Executing a program when a resource fails
A very powerful new feature was recently added to Overseer network monitoring software, in 5.0.101. This feature is the Overseer ‘Actions’ system. Actions are processes that can be triggered when monitoring– typically when a resource fails, or new events are available. Currently the only action type, is to execute a program– but being able to execute a program with parameters is an incredibly powerful feature, enabling you to do almost anything.
Actions are configured under Manage->Actions. You can also ‘test’ an action, making it easier to get your parameters just right. Once you have an action defined, you must link this action to a resource. To do so, edit a resource and choose the ‘Actions’ option in the left tree. You can then use the ‘Add’ button to choose the action you’d like, along with the trigger type. Now, whenever that instance(such as ‘first failure’ or ‘every failure’) occurs for that resource, the action will be executed.
Additionally, under the ‘History’ tab for a resource, you can see the full detail of any actions that are triggered– both the input(command line, including parameters) as well as the output(stdout and stderr from your executed program).
Being notified when a computer is connected to network
Although Overseer Network Monitor is primarily used to notify administrators of problems when a resource goes down, some administrators have other requirements as well. A customer recently contacted me needing to be notified whenever one of his mobile users connected his laptop to the corporate network. He needed this so he could push policies to them– but this could be useful for many things, such as general network security.
The primary way this is done with Overseer, is with the new ‘Reachable’ setting for a ping resource. There are a few other settings that are best to tune as well. Here’s a step-by-step on setting up a system like this.
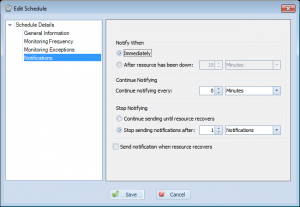
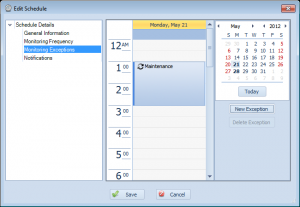
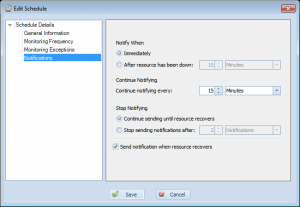
First, let’s create a schedule. This defines when these computers should be checked for and how often notifications should be sent. You can define when they are checked by setting values on the ‘Monitoring Frequency’ and ‘Monitoring Exceptions’ screens. For notifications, something like this would probably be ideal:
As you can see, this instructs Overseer to send notifications immediately(as soon as it detects the laptop is connected), do not notify repeatedly(setting of 0 minutes), and to stop sending after 1 notification has been sent. I’ve also unchecked the ‘Send notification when resource recovers’, as this doesn’t matter for us. Name this schedule something appropriate, such as “Mobile Computer Detection”.
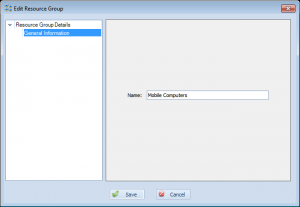
Next, let’s create a resource group for these laptops to keep them separate from our other resources. This can be done by going to manage->resource groups and adding one. Give it an appropriate name, such as “Mobile Computers” below:
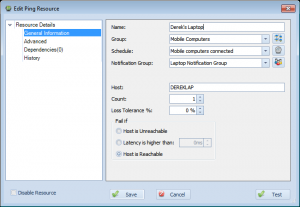
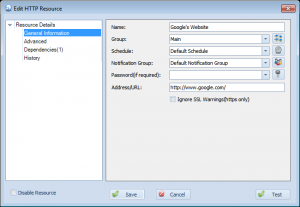
Next, let’s create an actual resource. Go to New Resource->Ping. Create a resource with settings something like below:
As you can see, I’ve created a resource labeled “Derek’s Laptop”, assigned it to the ‘Mobile Computers’ group I made, assigned the ‘Mobile computers connected’ schedule, and assigned it to a “Laptop Notification Group” notification group I also created(which includes my Email, but not my cell phone, for example). I set the host name to the name of my laptop, and set the fail if setting to ‘Host is Reachable’.
Click Save, and now Overseer will send you a notification whenever that host is connected to the network. Based on our schedule settings, we will also not be notified repeatedly, nor when the computer is removed from the network– but we’ll be notified again if the computer is hooked up after being disconnected. Note that the laptops will need to have their firewalls configured to allow ICMP/Ping requests, if they aren’t already.
Warns and prevents deletions of items that are used
Previous versions of Overseer would sometimes let the end user accidentally delete something important… Most notably, Overseer would allow the user to delete a resource group that has resources in it. This would make those resources inaccessible, even though they’d still be monitored and alerts sent. This is obviously not a good thing, so in Overseer 5.0, I went through all the ‘things’ in Overseer, and added a quick check when deleting them– now if you try to delete a notification, notification group, schedule, resource group, etc. that is in use by another item(i.e. a resource using a schedule for network monitoring), Overseer will prevent you from doing so and explicitly tell you why.
Enhances availability report to support reporting based on intervals(hourly, daily, etc.)
Overseer has long supported reporting on the availability of resources. This is often used by ISPs to determine their uptime for service level agreement reasons. This used to be only available on screen, but with Overseer 4.x, we added the availability report.
Overseer 5.0 enhances the availability report further, by allowing you to pick an interval– hourly, daily, etc. This lets you see your availability in % based on each segment of time in your date period, at the intervals specified.
Changes event log custom text to use built-in custom text system versus resource-specific fields
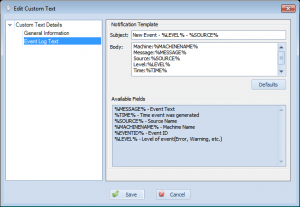
Overseer has supported event log monitoring for quite some time. It has also supported the ability to have custom text when sending notifications for a new event log entry. In Overseer 4.x, this custom text was directly on the edit resource screen. In Overseer 5.x, this has been moved to the common ‘Custom Text’ section. This allows you to easily specify the custom text you want for event logs, and link it to all your event log resources, instead of having to set it on each event log resource. This interface also shows all the custom variables you can use:
This should make Overseer simpler to use for event log monitoring.
When a service is stopped and started due to a dependency failure, dependent services are also stopped and restarted
Overseer has supported resource dependencies for quite some time now. Overseer service monitoring also supports the ability to restart a service if it’s unavailable. As of Overseer 5.0, Overseer will also attempt to restart any dependent services of the service. Note that the dependent services must be properly defined in the Windows registry when registering the service– these are Windows Service dependencies, and not Overseer dependencies.
Move resource history interface from right click to ‘History’ entry in left tree of Edit Resource dialog
Overseer has supported showing history on resources since the beginning. This can be useful to determine what happened historically, for tracking availability, etc. In previous version of Overseer, this used to be under the right click menu– you had to right click a resource and select ‘Show History’. Unfortunately, this right-click function was often missed by many users– and they had no idea this feature even existed!
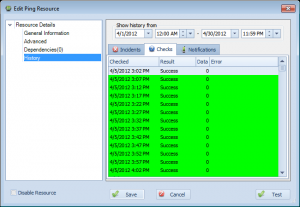
With Overseer 5.0, the resource history– including incidents, checks, and notifications sent– is now in the main edit resource dialog. Simply open a resource and select ‘History’ on the left. You can then browse the history easily, using the interface as shown here:
As you can see, this shows the full history of checks, so you can see the history when using Overseer for service monitoring, ping monitoring, disk space monitoring, or any other Windows network monitoring.
Adds the ability to group resources by host/machine in resource view
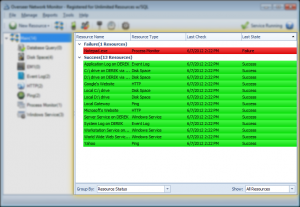
While other network monitoring software focuses on ‘servers’, Overseer has always been based around ‘resources’. Some users, however, still want to be able to see their resources grouped by server. With Overseer 5.0, I’ve added a feature to the resource view to enhance the ability to group resources:
This allows for grouping resources by these options:
- No grouping – resources are displayed flat, without any grouping
- Resource Type – This groups resources by their resource type(ping, windows service, etc.)
- Host/Machine – This groups resources based on the machine they’re hosted on. Note that for some resource types, such as HTTP, this will simply be the URL– but for windows services, process monitors, disk space, event logs, and more– you’ll see the actual host.
- Resource Status – This groups resources by failure/success status, so you can easily see all the resources that are down together
Enhances text import wizard to support importing multiple fields and more resource types
One of the difficulties with Overseer in the past, has been getting resource configuration data into the software. In Overseer 4.x, we introduced both the auto-discovery wizard and the text file import wizard. The text file import wizard in Overseer 4.x was fairly basic, in that only one field could be imported.
In Overseer 5.x, this wizard has been enhanced to support multiple fields– you can import both the computer name and the service name for services, for instance. This should make it easier to import resources for service monitoring and other IT monitoring purposes.
Changes Edit Schedule layout to hopefully make things easier to understand
Over the years, Overseer has used many different ways to define how often a resource is polled. In Overseer 3.0, this was moved to schedules– each resource was linked to a schedule, which defined how often the resource was monitored, and when notifications are sent. This was a major step forward, as previous to this, each resource had to have these settings set manually.
Even still, some of the settings for schedules can be confusing. In Overseer 5.0, with the new property-tree layout that’s used throughout Overseer, I’ve broken the old ‘edit schedule’ dialog into multiple sections.
General Information
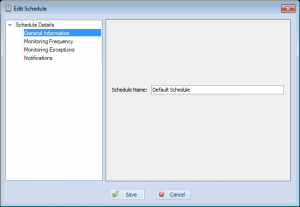
The first is the ‘General Information’ page. Right now, this just has the name of the schedule. This is how you refer to the schedule throughout Overseer.
Monitoring Frequency
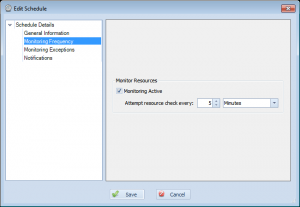
The next page is the ‘Monitoring Frequency’ page. This simply defines that resources using this schedule are set to monitor(active yes/no), and how often those resources should be polled.
Monitoring Exceptions
This next page is for ‘Monitoring Exceptions’. This is where you define exceptions to the schedule– such as for maintenance periods.
Notifications
This last page lets you define how notifications are sent. This is generally the most confusing of the pages, but breaking it out into its own page makes it a little easier to understand. The basic idea here, is that this screen lets you define when notifications are sent after a failure is detected(right away, or wait a period of time), how often they get re-sent, and when to stop sending them(when resource recovers, or after a specific period of time or notifications sent). Lastly, you can specify that you want to receive notifications for recovery(generally most people will always want this on)…
Hopefully breaking out what was a far more complex screen into multiple pages here will make Overseer even more easy-to-use network monitoring software.
Changes edit resource form to include tree-based view on left
Overseer 4.x has used a simple dialog to edit all resource types since Overseer 3.0. As we’ve added more features, this dialog has gotten larger and been more and more clunky. With Overseer 5.0, this dialog has been replaced with one that supports a property tree on the left. This is a fairly standard GUI component of modern day software, so we felt this was the way to go. Here’s a screenshot:
As you can see, on the left there is a tree with ‘General Information’, ‘Advanced’, ‘Dependencies’, and ‘History’. Clicking them will change what appears on the right side of the dialog. This allows us to provide far more functionality in the same dialog, and logically spread it out to make Overseer easier to understand and simpler to use IT monitoring software.
Adds the ability to set group/schedule/notification group/passwords defaults in options for all new resources
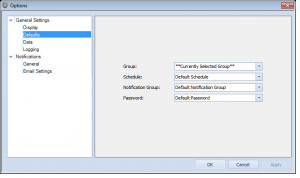
Each resource created in Overseer has certain fields in common. Most users will use only 1 of each of these things– schedules, notification groups, passwords, and groups… Many more advanced users will use more than one, however. In previous versions of Overseer, these things would always default to the first entry, or to blank for each new resource. This made adding resources more cumbersome than it should be.
In Overseer 5.0, I added the ability to specify the default for groups, schedules, notification groups, and passwords. Simply go to Tools->Options and then select General Settings->Defaults:
This should make Overseer quicker to setup for both paid users and those that opt for using it as free network monitoring software.
Adds the ability to edit multiple resources at once
One of the biggest complaints users have had about Overseer in the past few years, has been the difficulty in maintaining large numbers of resources. If something needs to be changed on all of them, each one must be edited one-by-one. Even though the need for editing these resources has been reduced significantly by using notification groups, schedules, linked passwords, etc., it is still occasionally required.
With Overseer 5.0, this problem is solved– if you have many resources you’d like to edit all at once, simply select them(shift/ctrl+click), and right click->edit resources. This will bring you up with an edit resource dialog where you can easily change settings. If all the resources are of the same resource type, you’ll see resource type specific settings– if you have resources of multiple types, only the common values will be available.
Try it out– this should make Overseer even quicker to use, making it very easy-to-use network monitoring software.
Adds the ability to filter processes by command line as well as process name
Overseer 4.x added support for monitoring Windows processes. This is a very well-used feature by many users– people use it to monitor all sorts of software– to make sure it’s running, and sometimes to make sure it’s not running.
Overseer 4.x was only able to match processes based on process name, however. This made it difficult to match certain processes that were used for scripts, such as cmd.exe or powershell.exe… Overseer would always match multiple processes, and not specifically the one the user was after.
With Overseer 5.0, I’ve added an additional field, allowing you to filter based on the command line– the parameters passed in on the command line are great for determining which process. This is useful for determining if a script is maxing CPU, using excess memory, etc. It can also be useful for IIS application pools, for instance.
Adds the ability to process monitor to notify when process exceeds CPU% threshold
With Overseer 4.x, we introduced the Windows Process Monitor resource type. This has been well received, and now many customers use Overseer as their primary process monitoring software. Overseer already supports monitoring the # of processes, lack thereof, memory consumption, etc. One check that many customer have asked for, however, is failing if the CPU% for the process gets too high.
In Overseer 5.0, we’ve added this feature to our process monitor software. Now, you can set a process monitor resource type to fail if the CPU% goes above a defined threshold.
Adds ‘edit’ button when managing notifications, schedules, etc.
Overseer has used a standard interface for editing items in Overseer for quite a while. This standard interface makes navigating the software simple-to-use. One thing that was pointed out by one user, however, is that there was no ‘edit’ button on the list screen. Existing users of the Overseer network monitoring software obviously know that you just double-click the item to edit it, but this wasn’t clear to all users.
To accommodate this user, and hopefully make things more obvious to other new users, I’ve added an ‘Edit’ button under the list. This is the same as double clicking the item.
Adds filtering abilities to all item(schedule, notifications, etc.) list screens
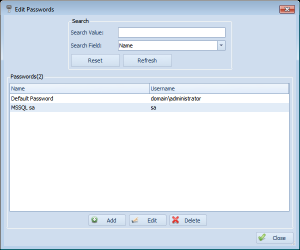
One of the new features in Overseer 5.0, is the ability to easily filter edit list– when you’re editing schedules, notifications, etc., you can easily find what you’re looking for using a drop-down and a search field, as you can see in this screenshot:
This can be very useful if you have a large number of passwords, notification groups, etc. This is yet another feature that makes Overseer simple-to-use network monitoring software.
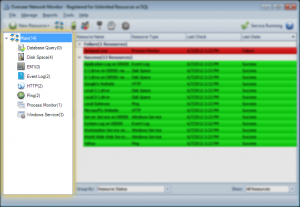
Adds resource count to each node of resource group tree on left
Overseer’s interface has almost always shown resource groups on the left, with each resource type underneath, in a tree format. This is a very simple layout that lets the user easily drill down, as they choose. This simple layout is part of what makes Overseer very easy to use network monitoring software.
With Overseer 5.0, we’ve added a simple resource count to each node, indicating how many resources are in that node. This makes it easier to see how many resources you have in any specific group/type, and can save time manually checking by moving to that group/type.
Enhances auto-discovery wizard to allow discovered hosts or manually entered hosts, better check/uncheck in tree, etc.
The biggest and best feature added in Overseer 4.1, was the auto-discovery wizard. This wizard lets you easily setup multiple resources in Overseer by simply polling your network. In 5.0, this wizard has been revamped to be a little smoother, and give the option of discovering hosts from active directory, or using a manually entered list. The wizard also gives you a choice when discovering hosts via active directory, as to which hosts to actually probe– providing you with a full tree if you have organizational units setup in Active Directory.
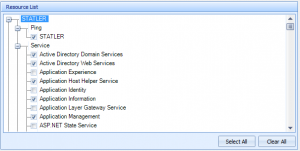
Finally, once the hosts have been probed, Overseer lets you select the resources in a tree’d manner– easily selecting/deselecting an entire branch of the resource tree at a time– this can save a lot of time in fine-tuning which resources you want selected.
The auto-discovery wizard is possibly the most powerful feature in Overseer, enabling you to be up and running with the Overseer network monitoring software in no time.
Enhances interactive test dialog
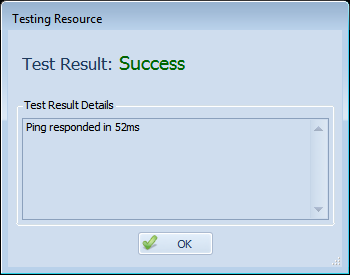
Overseer 5.0 has a new test dialog. This test dialog is a little more visually appealing, but also makes it easier to copy any error messages out for pasting into other programs, such as Emails. In the future, this dialog will hopefully be used to display more detailed error messages and links to blog posts that may be helpful in diagnosing the issue.
Memory usage or process counts are always logged in the ‘data’ field for process monitor checks, regardless of failure/success
Most resource types in Overseer log some sort of data to the ‘data’ field, accessible by looking at the resource history. This can be useful for temperatures, response times, etc. With Overseer 5.0, the Process monitor was changed to properly log the memory usage or process counts to the data field with each check. This makes monitoring windows processes with Overseer a little more useful, even if you don’t have any failures.
Adds toolbar below menu for easy access to frequently used functions
Overseer has always been a simple-to-use network monitoring tool, and as such, I’ve kept the interface rather simple. I personally didn’t see users accessing items in the drop-down menus often enough to justify a toolbar. However, some users definitely do access functions up there, and generally it’s just a lot faster when a user actually does.
So, with Overseer 5.0, I’ve added a toolbar:
This toolbar offers a few icons:
- New Resource – this option lets you add a new resource to Overseer. Clicking it will show a drop-down of all the different resource types.
- Resource Groups – clicking this option will allow you to edit/add/delete your resource groups
- Notifications – clicking this option will allow you to edit/add/delete your notifications
- Notification Groups – clicking this icon will allow you to edit/add/delete your notification groups
- Passwords – Clicking this icon on the toolbar will let you add/edit/delete your passwords/credentials
- Schedules – If you select this icon, you’ll be able to add/edit/delete your schedules.
- Options – This option presents an easy way to access the Tools->Options section.
- Service Running – This displays the current status of the Overseer service. Clicking it when it says ‘Service Running’ will stop the service. Clicking it when it says ‘Service Not Running’ will start the service
- Help – This will launch the help file.
Adds the ability to see the status of the Overseer service and start/stop it from toolbar
Overseer Network Monitor depends on a Windows service to run. This Overseer windows service is what monitors your resources, sends notifications, etc. It’s critical that this service is running, so the start type is set to automatic. Up until now, however, the Overseer management application hasn’t displayed the current status of the service. Sure, when starting the management application it will prompt to start it if it’s not running, but if the service stops running otherwise, it’s of no help.
In Overseer 5.x, I added a user interface element that I’ve been meaning to for a while– a service status indicator. This service indicator is in the upper right corner on the toolbar, and shows the current status.
This is what it looks like when the service is running:
This is what it looks like when the service is not running:
Additionally, if you click the button, it will start/stop the service, based on which state you’re in. If the service is running, it will stop the service(not generally something you want to do, FYI). If it is not running and you click it, it will start the service.
This should give a nice visual clue as to what’s going on with your network monitoring software.
Adds splash screen when starting
Previous version of Overseer would occasionally take a little while to start, for one reason or another. This was sometimes a bit confusing to users. In Overseer 5.x, I added a simple splash screen:

This splash screen isn’t the prettiest out there, but it is functional, and provides information regarding what is going on when starting the Overseer network monitoring software.
Adds ‘Data’ section to options, allowing user to change location of Overseer database
Previous versions of Overseer all stored their data in a ‘Data’ subdirectory of the installation directory– typically C:\Program Files\Overseer\Data\. Microsoft frowns upon putting data in an application’s binary directory(or subdirectory), however– so in Overseer 5.x, the database has moved to the ‘proper’ place, according to Microsoft. Overseer’s data is accessed by ‘all users’, so on Windows XP and 2003, this is in C:\Documents and Settings\All Users\Application Data\Overseer\. On Windows Vista+, this has moved to the far simpler C:\ProgramData\Overseer\.
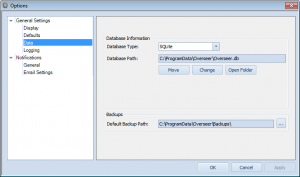
These directories aren’t always easy to navigate to, so I’ve added a simple interface in Tools>Options->General Settings->Data:
As you can see, this indicates the database type, database path, and provides a few buttons to manage this. The ‘Move’ button lets you change the directory your data is stored(this moves your database as well)– this is useful if you want to put the Overseer database on a network drive, for example. The “Change” button lets you point Overseer to a different location, where you already have an Overseer 5.x database. And lastly, “Open Folder” opens the data folder in Windows Explorer.
Adds the ability to run discovery for just one host
Overseer’s auto-discovery wizard is a very quick way to get up and running monitoring your network servers in no time. Previously to 5.0, the only way to use it, was to discover hosts from active directory, however. With Overseer 5.0, I’ve added the ability to enter a list of servers/host manually. This can be just one, or many. This is a great way to add monitoring for just one new server.
Overseer backup and restore wizard
Previous version of Overseer did not have a built-in system for both database backup and restoration. Later versions of Overseer 4.x had a backup wizard, but nothing to restore the database afterward. Overseer 5.x adds a robust new backup and restoration system, called the Backup and Restore Wizard.
This wizard makes backing up your database a snap. Simply start the wizard(Tools->Backup and Restore Wizard), select where to place your backup(defaulting to a sub-folder of the Overseer data directory), click next, and the backup is performed. The backup files are automatically named with the date and time, making it easier to see when the backup was done.
Backup files made by the wizard are simple files that can easily be copied or Emailed. They’re in SQLite database format, regardless even if you’re using a MSSQL server for your Overseer database.
Once you have a backup file, you can easily restore that backup by starting the Backup and Restore wizard again, and this time selecting ‘Restore’ and pointing to the file you’re interested in restoring. Note that restoring will overwrite any data you currently have in Overseer– so be careful when restoring backups.
Adds support for extended event logs in W2K8(“Applications and Services Logs”)
One of the big new features in Overseer 5.x, and the core reason for updating to .NET Framework 3.5, is support for Windows 2008 R2’s new extended event logs, termed the “Application and Services Logs”. Reading these event logs required a new API which was only available in .NET Framework 3.5.
Overseer 5.x now supports all of these event logs and the standard event logs. Unfortunately, the API requires Windows Vista, Windows 7, or Windows 2008+ to be running on the Overseer computer as well– so if your Overseer computer is running on Windows XP or Windows 2003, and you want to monitor extended event logs, you’ll have to upgrade the computer running Overseer. Unfortunately, this is a limitation of the API.
With this new feature, along with Overseer’s existing event log filtering, duplicate event detection, and more, Overseer’s event log monitoring software features should satisfy most user’s needs.
Enhances the schedule exceptions interface
Overseer has supported schedule exceptions for maintenance periods for quite some time. The interface to add the exception was a little clunky, and somewhat hidden. In Overseer 5.0, this interface has been moved to a page in the ‘Edit Schedule’ screen:
Exceptions are clearly shown on a calendar, with the ability to easily create a new exception, delete an old one, or double click to edit a current one.
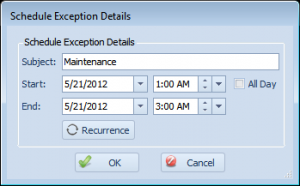
Once you edit an exception, you’re presented with this screen:
This screen lets you specify a subject/name for the exception(this is for your reference), the start/end date and times for the exception, along with a button to set a recurrence. Recurring exceptions are useful if you have maintenance occurring at the same time on a schedule(i.e. a weekly server reboot).
Monitoring exceptions are a key feature to have in your network monitoring software, and Overseer fully supports this feature.
Using MSSQL for Overseer’s database
One of the new features in Overseer 5.x, is support for using Microsoft SQL for Overseer’s database. Overseer already supported, and continues to support database monitoring, but this feature is different. Normally, Overseer uses a SQLite file-based database, stored on the local file system. This works quite well, but some people with very large data needs, or those that want easier access to the data for reporting purposes, would prefer to use MSSQL. You can use Microsoft SQL Express, Standard, Data Center, MSDE, etc.– any version of MSSQL except Microsoft SQL CE should work.
Overseer 5.x includes an optional MSSQL add-on module that allows Overseer to use MSSQL as the Overseer database. If you’ve purchased the module and would like to configure MSSQL, this blog post will show you how. If you need to purchase the module, it’s available on this page:
http://www.overseer-network-monitor.com/UpgradePricing.aspx
Creating the database:
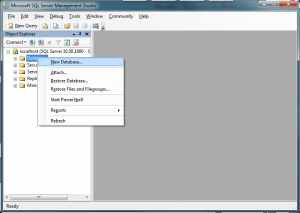
First, create a database in MSSQL. This can be done in Microsoft SQL Server Management Studio by right clicking on ‘Databases’ and selecting ‘New Database’:
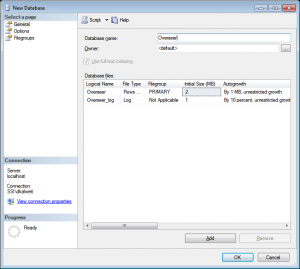
Name the database whatever you want. I am using ‘Overseer’ in the example below:
Database Login
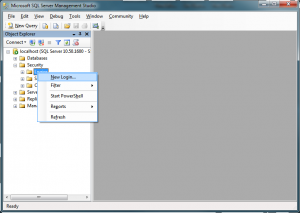
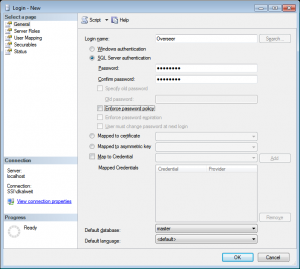
Next, you must create a database login. You can do so in MSSQL Management Studio by going to Security->Logins, right clicking, and choosing ‘New Login’:
Create a login such as the one below, named ‘Overseer’. I’ve used SQL authentication, but you can use Windows authentication if you’d rather. I do not cover the steps involved in setting up Windows authentication in this blog post.
Creating the database user
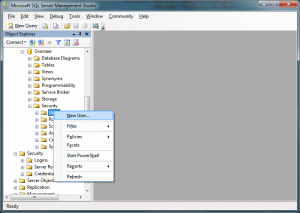
Now that we’ve created the database and the server login, we must create the database user. To do this, expand the database, down to Security->Users, and right click and select ‘New User’:
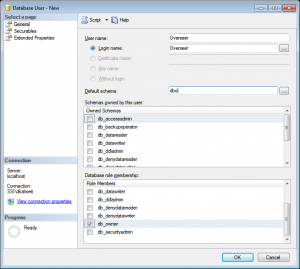
Create the user with the name ‘Overseer’, select the login we created below, set the ‘Default schema’ to dbo, and check “db_owner’ in the ‘Database role membership’ section only:
Overseer Configuration
Now that we have the database created, the MSSQL login created, and the database user created with the appropriate permissions, it’s time to point Overseer to this database. If you plan to upgrade your existing Overseer database, please back it up using the Backup and Restore wizard first. We’ll be restoring it after.
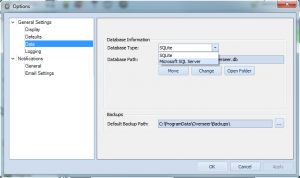
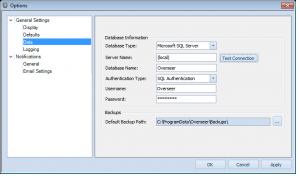
First, go to Tools->Options, and then choose General Settings->Data. Select ‘Microsoft SQL Server’ from the ‘Database Type’ dropdown:
Once Microsoft SQL Server is selected, you’ll be presented with different options. Please enter in the appropriate values– you can use (local) for the MSSQL server if it is installed on the same computer as Overseer– otherwise, enter the server name. For the database name, enter the database we created above. The user is the login name we created above, and the password is the password you used for the MSSQL login:
Click ‘Test Connection’ to make sure things are setup, and then click OK.
At this point, Overseer should be using the new MSSQL database. If you backed up your old database, you can restore it now using the Backup and Restore wizard. Otherwise, you should have a clean, empty database that you can start filling. It may be helpful to use the resource discovery wizard for this purpose.
Overseer resource dependencies
I’ve recently had a couple customers ask me about dependencies. This is a relatively new feature in Overseer, so some of our existing customers don’t even know exactly how to use them. They are rather hidden, but will become more visible in the next major version of Overseer. While hidden, resource dependencies can be very powerful in controlling excessive notifications when a single point of failure goes down, such as an internet connection.
Overseer lets you specify multiple dependencies, although often times this will just be one– such as an internet connection or pinging a server before attempting to monitor Windows event logs, services, disk space, websites, etc.
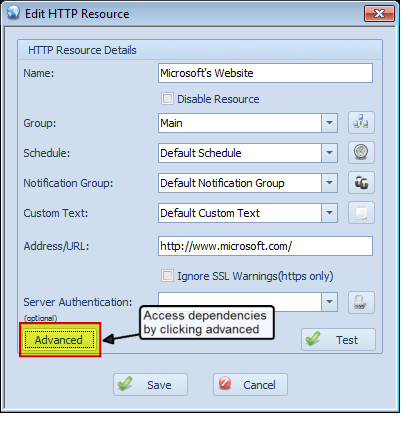
To setup a dependency, first click the ‘Advanced’ button on the resource dialog:
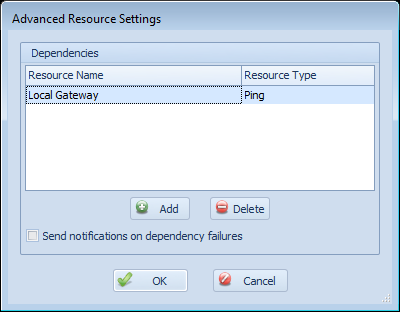
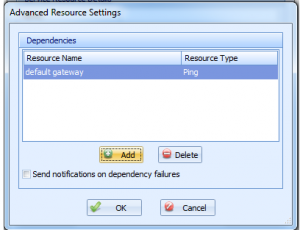
This will bring up a dialog that lets you add and remove dependencies:
On this screen, click the ‘Add’ button to add a dependency or ‘Delete’ to delete one. You can also select the “Send notifications on dependency failures” setting. When this is checked, Overseer will send a notification to the user when the resource dependency fails. For example, the resource in this example is “Microsoft’s Website”. Overseer will first check the status of the configured ‘Local Gateway’ dependent resource, and if it is down, it will normally not check or send notifications for “Microsoft’s Website” being down– it will simply go to ‘Failure’ status silently instead– ideally so you can get one notification that “Local Gateway” is down, instead of dozens that other resources that depend on it are down as well. However, if this checkbox is checked, notifications will be sent about “Microsoft’s Website” being down when Overseer determines that the “Local Gateway” dependent resource is down.
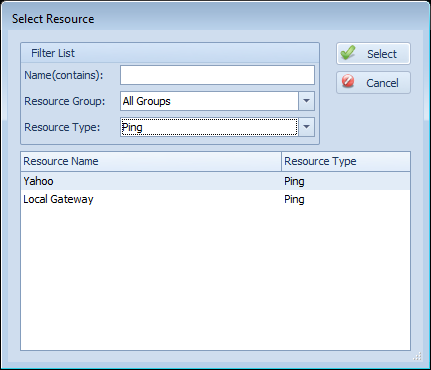
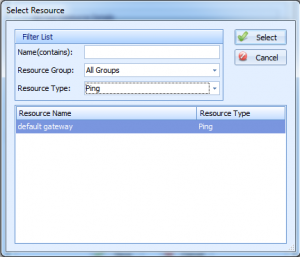
When clicking ‘Add’ on the resource dependencies screen, you’re presented with this dialog:
This dialog lets you find a resource more easily by filtering– by name, type, and resource group. Once you find the one you’d like, simply double-click it, or select it in the grid and click ‘Select’.
Reporting in Overseer
Reporting is an aspect of Overseer that has been quite weak for quite some time. There are some ways to get historical information through the ‘Show History’ and ‘Show Availability’ right click options on a resource, but nothing that can easily be printed, and no multi-resource reports available.
I am currently working on adding some reporting functionality to Overseer. I’ll start with some simpler, yet still useful reports such as a Resource Incident report– which can be run for a resource group or an individual resource. Availability reports should be next. All reports will be exportable to PDF, HTML, Excel, and more. Stay tuned for a future release that includes these reports.
Resource Discovery Wizard
The resource discovery wizard allows you to discover resources on your network so you don’t have to manually enter all your resources into Overseer. This wizard does require your computers to be a member of a Windows domain/active directory. It also requires a domain admin password to be used to setup the resources. This is generally the architecture most Overseer customers already use, so this shouldn’t be a significant limiting factor for most.
To run the resource discovery wizard, simply select the option under Tools, and follow the instructions:
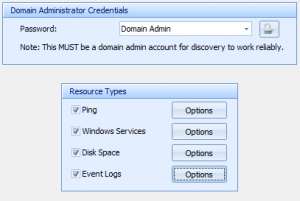
First, you must specify a domain admin account for discovery to work reliably. You can then select the different resource types you want selected. Click the ‘Options’ button to specify resource-type-specific options.
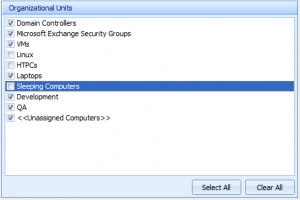
Next, you can specify the Organizational Units(OU’s) in your domain that you’d like to discover for. This can help limit the scope of your discovery to just servers, just user’s workstations, etc. If you don’t have OU’s setup, you may see just “<<Unassigned Computers>>”– which includes all domain computers not otherwise assigned to an OU.
Next, you simply wait for discovery to complete. Overseer may take a while to connect to all computers and discover all their resources. If you have computers that are powered down in OU’s you’ve decided to discover, this may take even longer. Fortunately, Overseer discovers resources on multiple computers at once during this process.
On the next screen, pick the resources you’d like Overseer to monitor. By default, Overseer will check all the services that are in running state, all event logs, all disks, and all ping resources. This may be overkill for a good monitoring strategy– so you may want to go through and uncheck some services, if you know which ones do not need monitoring.
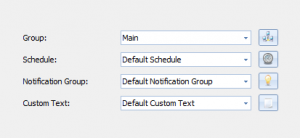
Next, specify the resource group, schedule, notification group, and custom text. If you’re not sure, the defaults will probably work.
Lastly, you simply let Overseer create your resources. Once that’s done, click ‘Finish’ and you should have many resources configured for you in Overseer.
Resource Dependencies
With a comprehensive resource monitoring strategy, it’s very likely that you have a large number of resources dependent on other resources. This might be an internet link tested via Ping Monitoring, or possibly you’d like to ping a server before doing your Website Monitoring.
Overseer now lets you specify one or even multiple dependent resources for any resource in the system. To setup a dependency, simply open your resource and follow these instructions:
First, click the ‘Advanced’ button on the resource dialog:
This will present you with the dependencies list:
Click ‘Add’ on this screen to add a dependency:
Note that you can filter all your resources by groups, types, and the name.
Once you’re done, simply click ‘ok’ through all the dialogs to save your changes.
When a resource is checked, the current status of dependent resources are checked first. If any of them are offline, the resource is not checked and immediately enters a ‘failure’ state itself. If you have ‘Sent notifications on dependency failures’ checked, you’ll get notifications for the resource being effectively offline due to the dependency failure. Most of the time you won’t want to check this box, as you likely already got a notification that the dependent resource is down.
Event Log Duplicate Filtering
Multiple customers have requested the ability to filter duplicate event log notifications when they’re monitoring Windows Event Logs. At first glance, this may seem like a simple thing, but it’s a little more complex than that.
If you want to enable duplicate event log filtering, you’re going to have to enable this feature on your event log resource(s):
As you can see, you must check the box to prevent duplicates, and then specify a number of minutes as the ‘duplicate’ time window. After this amount of time, if the event is seen again, you’ll get another notification. This is critical, as otherwise you may not get event log entries because you had the same event logged days, weeks, or even months ago.
The second value is the ‘Detection Method’. Windows Event Logs use a source name(such as the name of an application) along with an Event ID. This event ID is a number defined by the source of the event. The last value is the message. This message is usually unique to the specific time an event happens. The event ID usually indicates the type of event happening(i.e. “unable to write to file”), and the message indicates some data specific to that event(i.e. which file cannot be written to). This option lets you control how duplicates are detected.
Schedule Exceptions
Many customers have asked for the ability to specify maintenance periods for their system and network monitoring with Overseer. Well, as of Overseer 4.0.1026.03, this feature is now supported in Overseer! In this blog post, I’ll go over usage of this new feature.
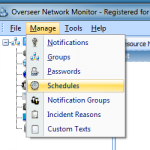
Go to Manage->Schedules:
Next, select your schedule:
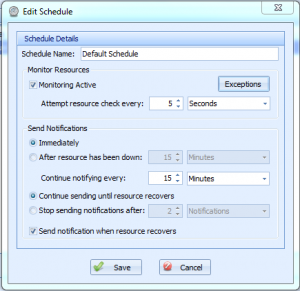
Once you’ve selected your schedule, you’ll be presented with the standard Overseer schedule screen:
Click the ‘Exceptions’ button and you’ll be presented with the main Schedule Exceptions screen:
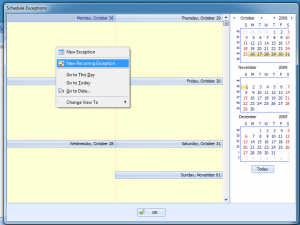
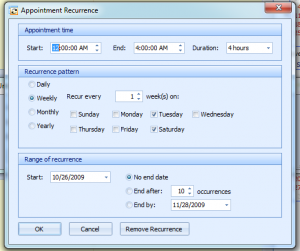
Right click on the calendar and select ‘New Exception’ or ‘New Recurring Exception’ if your maintenance period is regular(i.e. every Tuesday and Sunday night):
Now select the time periods/days for your maintenance period, and click ‘ok’ on each screen to get out. That’s it.
Schedule exceptions will prevent your resources that use this schedule from being monitored during these maintenance periods.
Categories:
- How To (28)
- Known Issues (5)
- New Features (36)
- News about Overseer Network Monitor (3)
- Tips and Tricks (55)
- Using the Software (51)
- Windows Monitoring (9)
